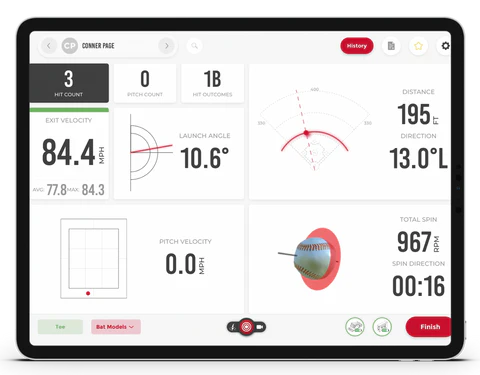
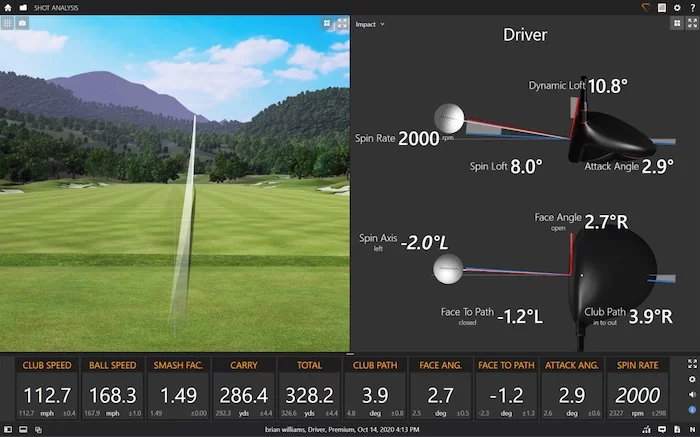
Golf found a number to explain the swing. Baseball found a number for the swing and the pitch. And in both sports, the moment a movement could be measured, the coaching changed — and player development started to accelerate. Now we see even more players hitting 330-yard drives, or throwing 104 mph fastballs, because the components of those skills are understood in far greater detail.
Basketball has been measuring for years. We have shot charts, effective field-goal percentage, shot-quality models, and a whole industry of tracking the outcomes of shots — where they're taken, how often they go in, how good the look was. All of it is valuable. And all of it describes the result of a shot. Very little of it (with the exception of measuring arc) describes the motion that produced it.
That's the gap. We can tell you a player shot 38% from the corner. We can't, with the same objectivity, tell you why — what their hand did, how the ball came off it, which part of the movement is quietly costing them makes. That question has always been answered by eye, by experience, by opinion. ShotMetrics is my attempt to answer it with numbers — a framework I've built over years of coaching at the NBA level and publishing peer-reviewed research on how the ball actually behaves.
What ShotMetrics is
ShotMetrics is the quantification of how the basketball is shot. It assigns values to the individual parts of the shooting motion — the base, the sequence, the release, the spin — so those parts can be contrasted, compared, and studied objectively, rather than relying solely on anecdote, opinion, and a coach's experience.
Once a part of the shot has a number, everything changes. Two techniques can be compared on the same scale. A theory can be tested instead of argued. A player can be measured today and again in eight weeks, and the difference is real rather than remembered. It is the same move golf and baseball made a decade ago — moving beyond “did the shot go in” and more in the direction of “why did that shot go in?”
I'll say the honest part in one sentence: basketball is in its infancy here, and the technology still carries real limitations — but that gap is closing quickly, and it will close faster as the understanding catches up to the cameras. There is a reason that golf and baseball are so much further ahead: their sports are easier to measure. But just because basketball is harder to measure doesn't mean it is impossible.
“Shooting is built on consistent movement patterns. Without a way to measure those patterns, we're guessing.”
Tweet thisWhat measurement unlocks
Putting a number on the shot isn't the goal. It's the door. Here's what it opens for an educated coach:
- Relationships within the motion. How does the base relate to the release? Does a change in one part ripple into another? Measurement lets you see the shot as a connected system, not a list of isolated cues.
- Objective contrast between theories. Two coaches can disagree about a technique forever. Two measurements settle it — or at least move the debate onto evidence instead of authority.
- Targeted interventions. When you can see exactly which part of the motion is off, you fix that part — instead of overhauling a whole shot to chase a problem you can't quite locate.
- A truer picture of skill. Measurement lets us begin to separate which motor patterns are genuinely more functional from which are less — and to define shooting skill by more than the scoreboard.
- More intention and accountability. Coaches will be able to see if the drills they're designing are having the desired effect.
That last point is where this gets interesting. When you can quantify the parts of the shot, you can finally start to see whether players are improving before they become comfortable and confident in the movement, and their progress can inform the next series of coaching decisions.
CDL Coaching Toolbox
Several of these ShotMetrics — including the spin tools below — are built into the Toolbox to use on your own players. Free to try.
One measurement, two metrics
When we quantify a part of the shot, we can study it and contrast it between players. But quantifying it hands us a second metric that's every bit as important as the first: because we can now compare a player against their own shots, we get a real read on their consistency.
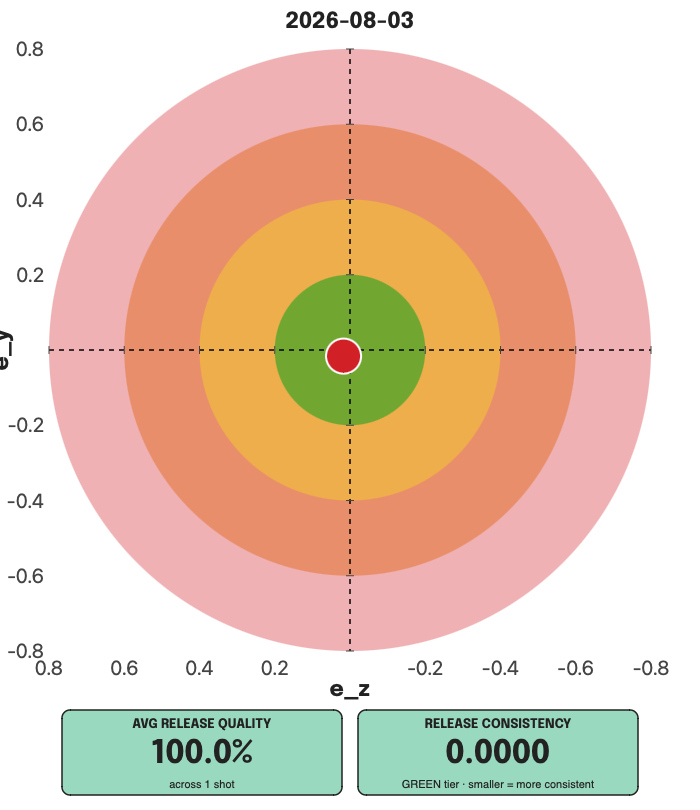
Below is the Release Quality of two shooters — one a weak shooter, one elite.
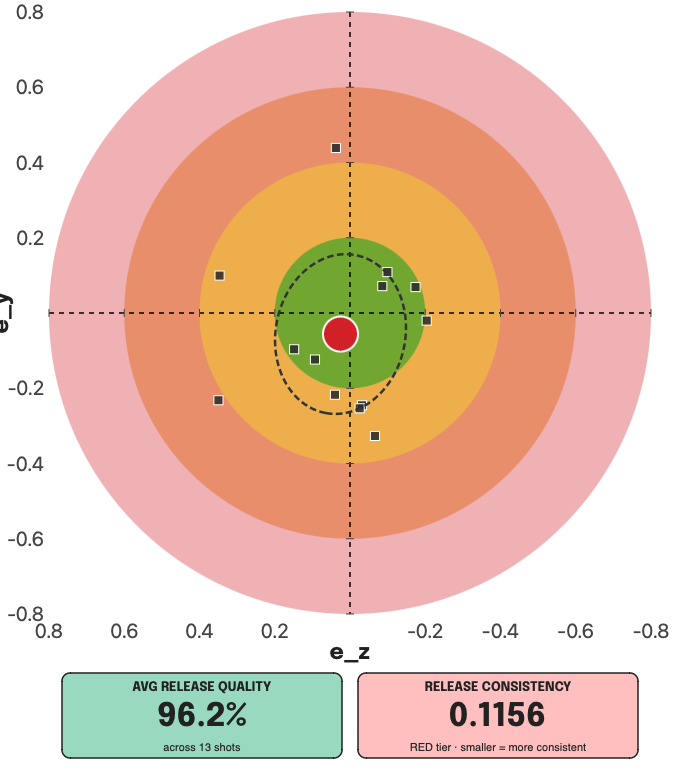
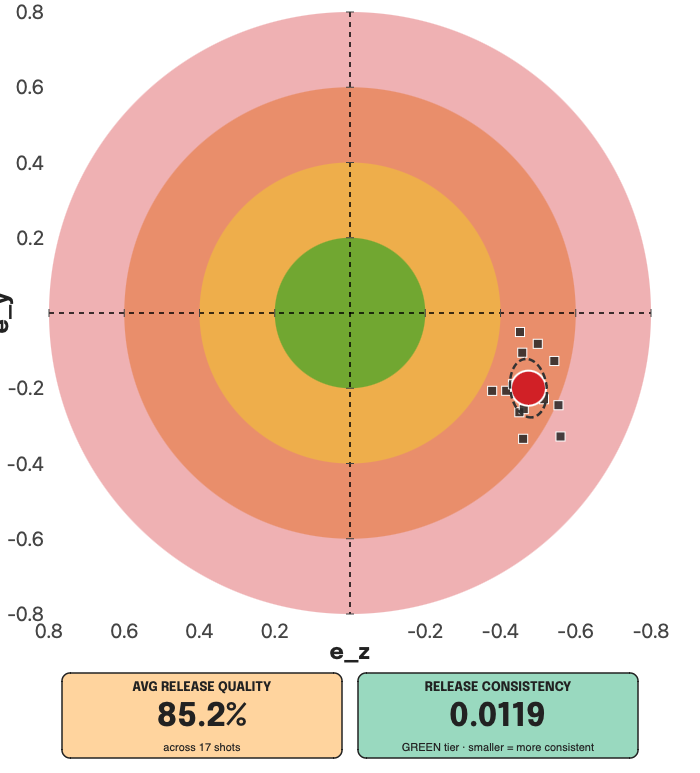
If we simply looked at the Release Quality number, we'd naturally assume the shooter on the left was the better of the two — on average, they released the ball more purely. But that's only half the story. The shooter on the right had a less pure release, and controlled it with precision.
If these two were golfers, the player on the left would be missing left and right, with their shots only averaging out somewhere near the middle of the fairway. The player on the right hit a bit of a slice — but the exact same slice, every single time. You always knew where that ball was going.
Knowing this changes how you coach each of them. A coach could watch the weaker shooter's release and never notice how much it varies from shot to shot — but the data tells that story plainly. That same coach might look at the better shooter's imperfect form and question whether it will hold up in games — and the data hints that the player is in full control of it.
“Some shooters win with an efficient movement. Others win by controlling a flawed one. ShotMetrics is how you tell which might need attention.”
Tweet thisTwo metrics for how the ball moves
I quantify a lot of the shot, but two ShotMetrics are backed by peer-reviewed research, and together they describe how the ball comes off the hand — the two ways a shot misses: left and right, and short and long. Once you know how the ball is moving, you can start to work out how the body needs to move to send it more efficiently.
Release Quality — the left/right axis
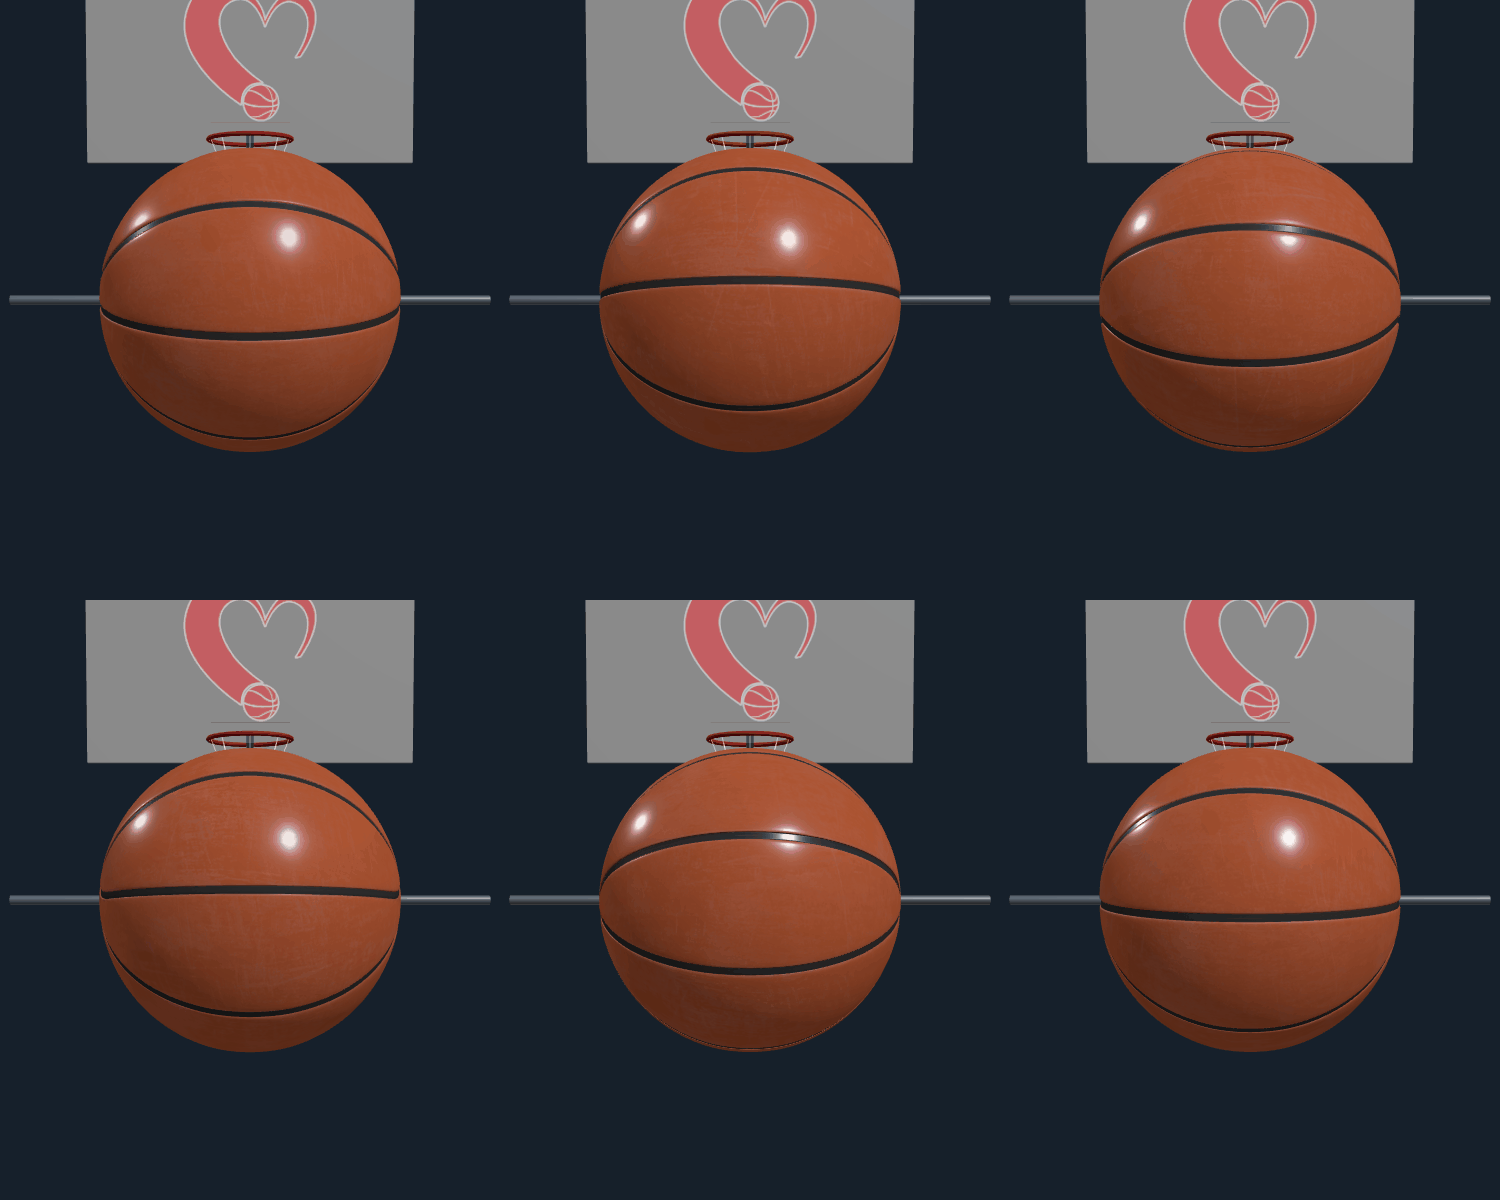
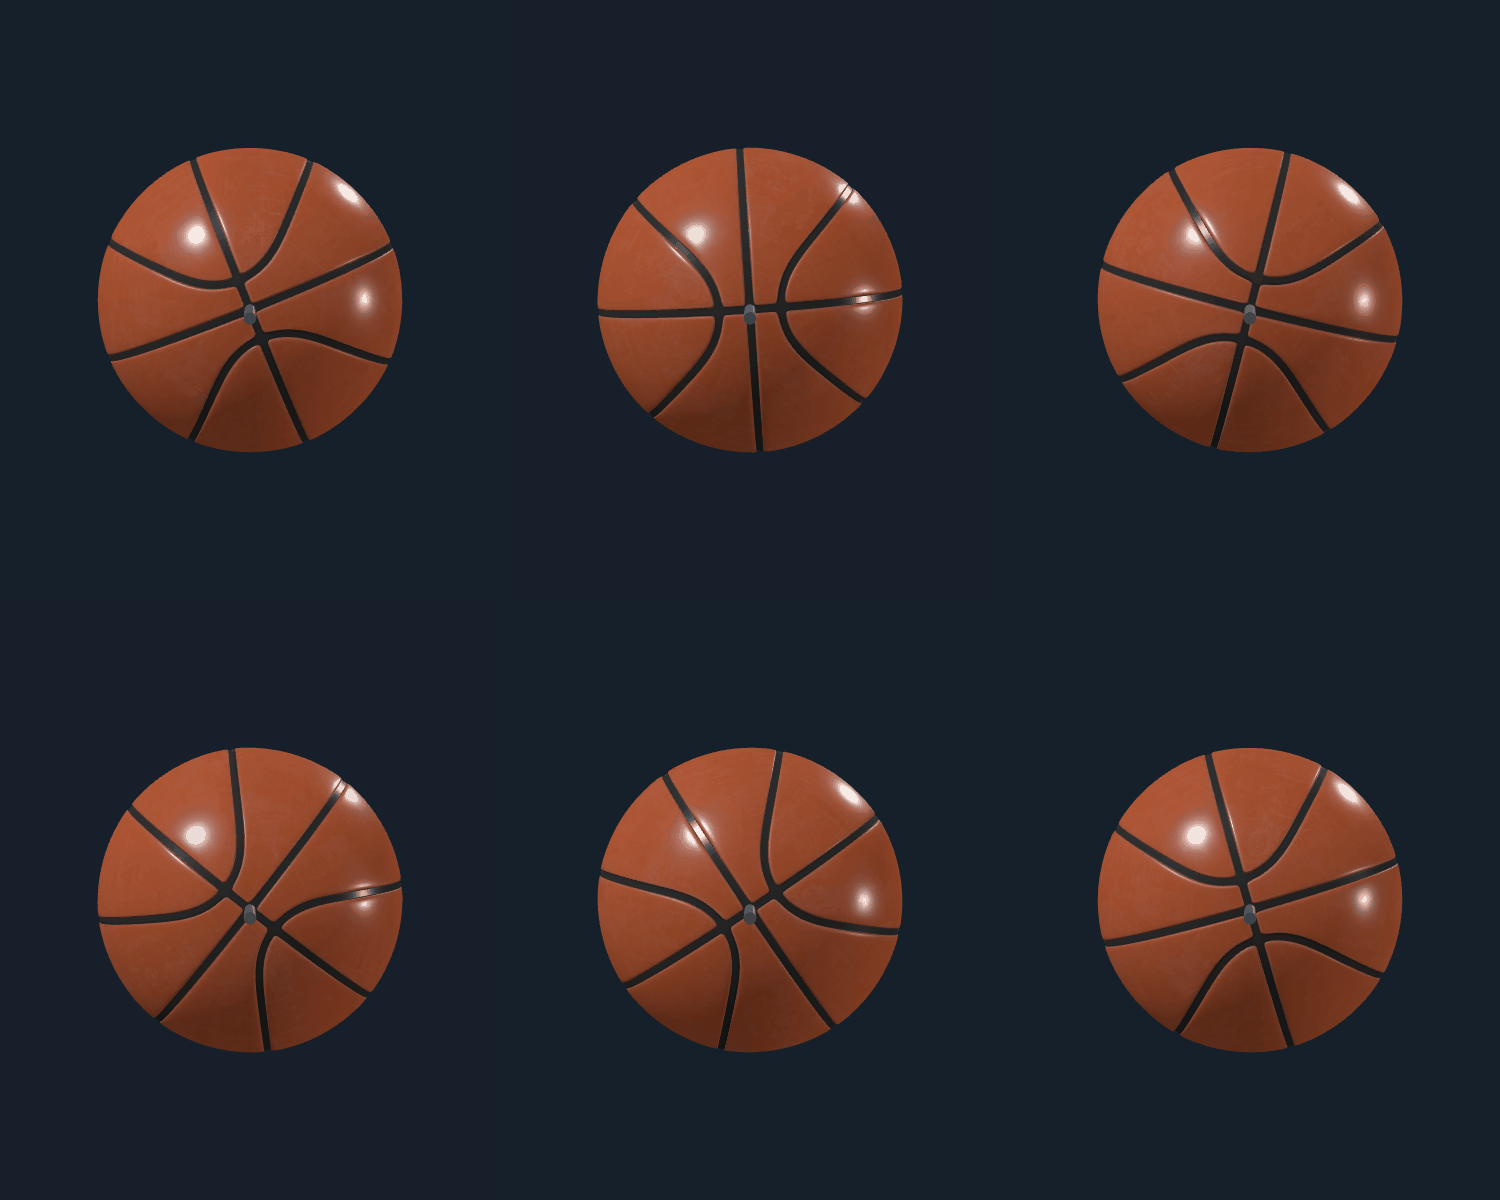
Release Quality measures the purity of the ball's axis of rotation and the symmetry of the force applied at release. A purely spinning shot leaves the hand with backspin rotating about a level, horizontal axis. When the push is uneven — a wrist that flicks slightly across the ball, a guide hand that interferes — the spin tilts off-axis, and that reveals an asymmetrical release of the ball, which could cause the ball to miss off-line. Release Quality is, in effect, a proxy for how well a player might control left/right misses. It grows out of research on backspin alignment and its variability (Slegers & Love, 2022).
Release Curvature — the short/long axis
Release Curvature measures how straight the ball travels from the set point (roughly at the forehead) to the moment it leaves the hand. Seen from the side, every shot traces an S: the ball lifts up and back to the set point, then drives forward to release. How sharply the path bends in that final stretch is Release Curvature — and a straighter path out of the hand means better control of distance.
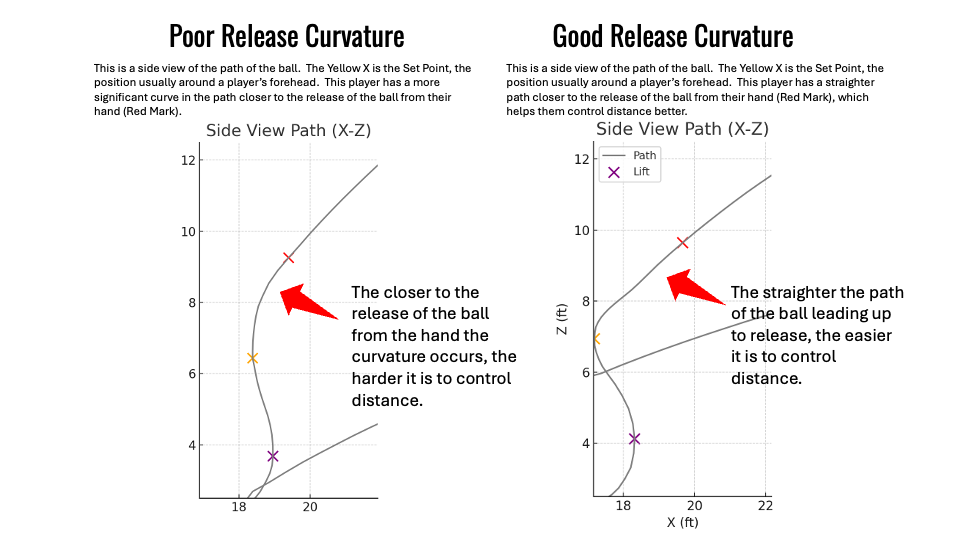
Conventional coaching wisdom typically suggests that a smoother S-curve should be encouraged. But in our study we found no correlation between the smoothness of the S-curve and accuracy — yet a strong correlation (r = 0.73, p < 0.001) between the straightness of the release and a shooter's control of distance — explaining more than half the variance. This same idea has now shown consistent results across three different versions of the study: from a published, peer-reviewed study on three-point shots in a controlled environment, to a study based on NBA in-game free throws, to an informal comparison of NBA in-game three-point shots.
For the first time, how a player shoots can be measured instead of guessed. Learn how Coach Dave Love uses ShotMetrics to coach the shot with data.
Share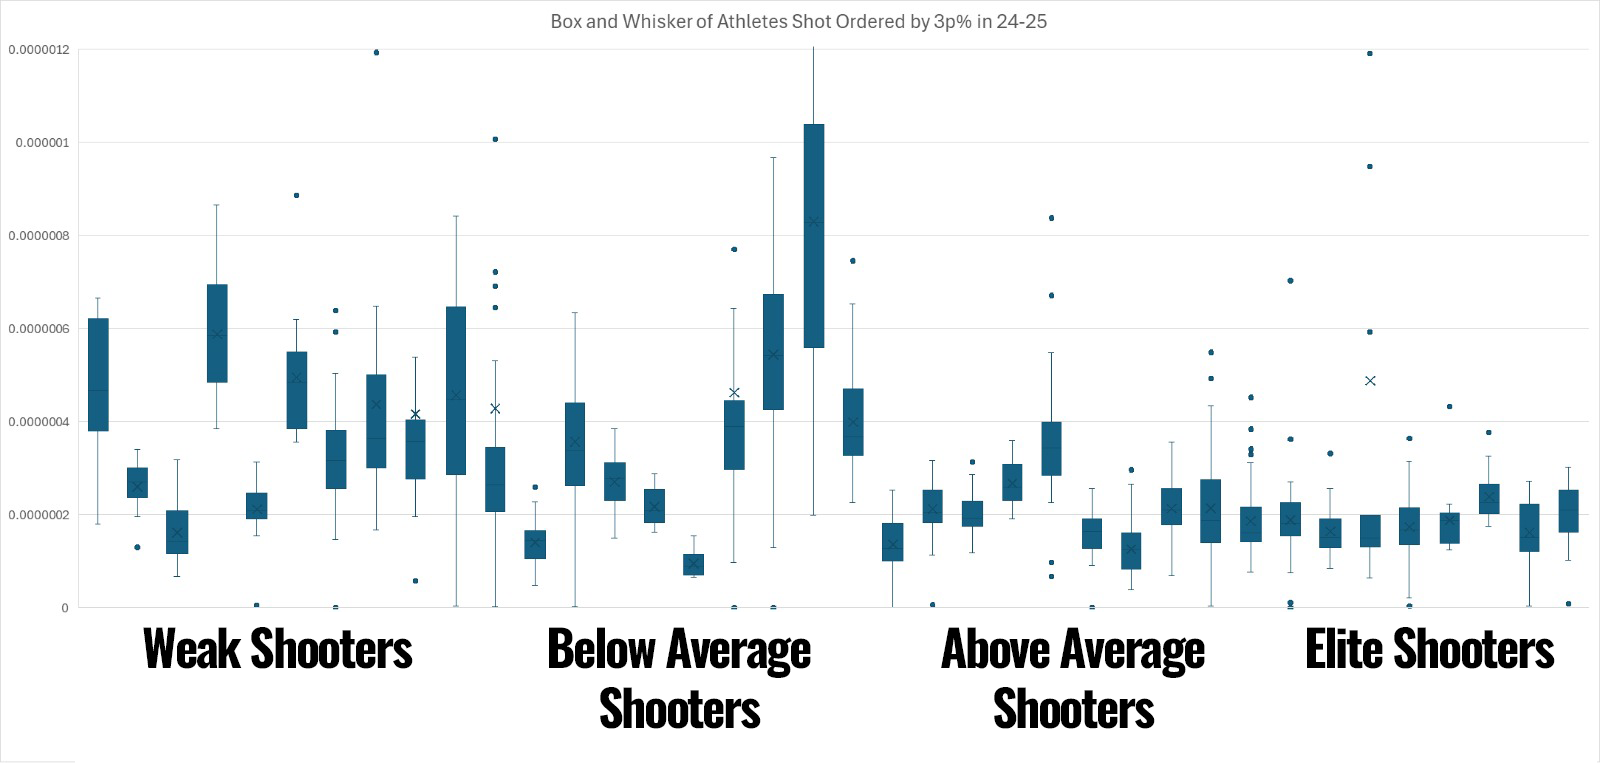
“Using a data-informed approach, we can begin to link how a player shoots — the movement itself — to how well they shoot. Not the make. The motion.”
Tweet thisThe expanding system
Release Quality and Release Curvature are the two ShotMetrics I'll defend with published data. They aren't the whole system. Beyond the release, I'm quantifying other parts of the motion — each earlier in its development, but each already teaching us something:
- Width of the base. How a shooter's feet are set, and how that stance relates to the rest of the motion.
- Sequencing of joint extension. Do the legs, hips, and arm fire in the right order — and does that sequence hold up shot to shot?
- Symmetry of the legs. Is force shared evenly between the legs, or is one side quietly doing more of the work?
- Arc and release velocity. Not just each on its own, but the relationship between them — how a shooter trades height for pace.
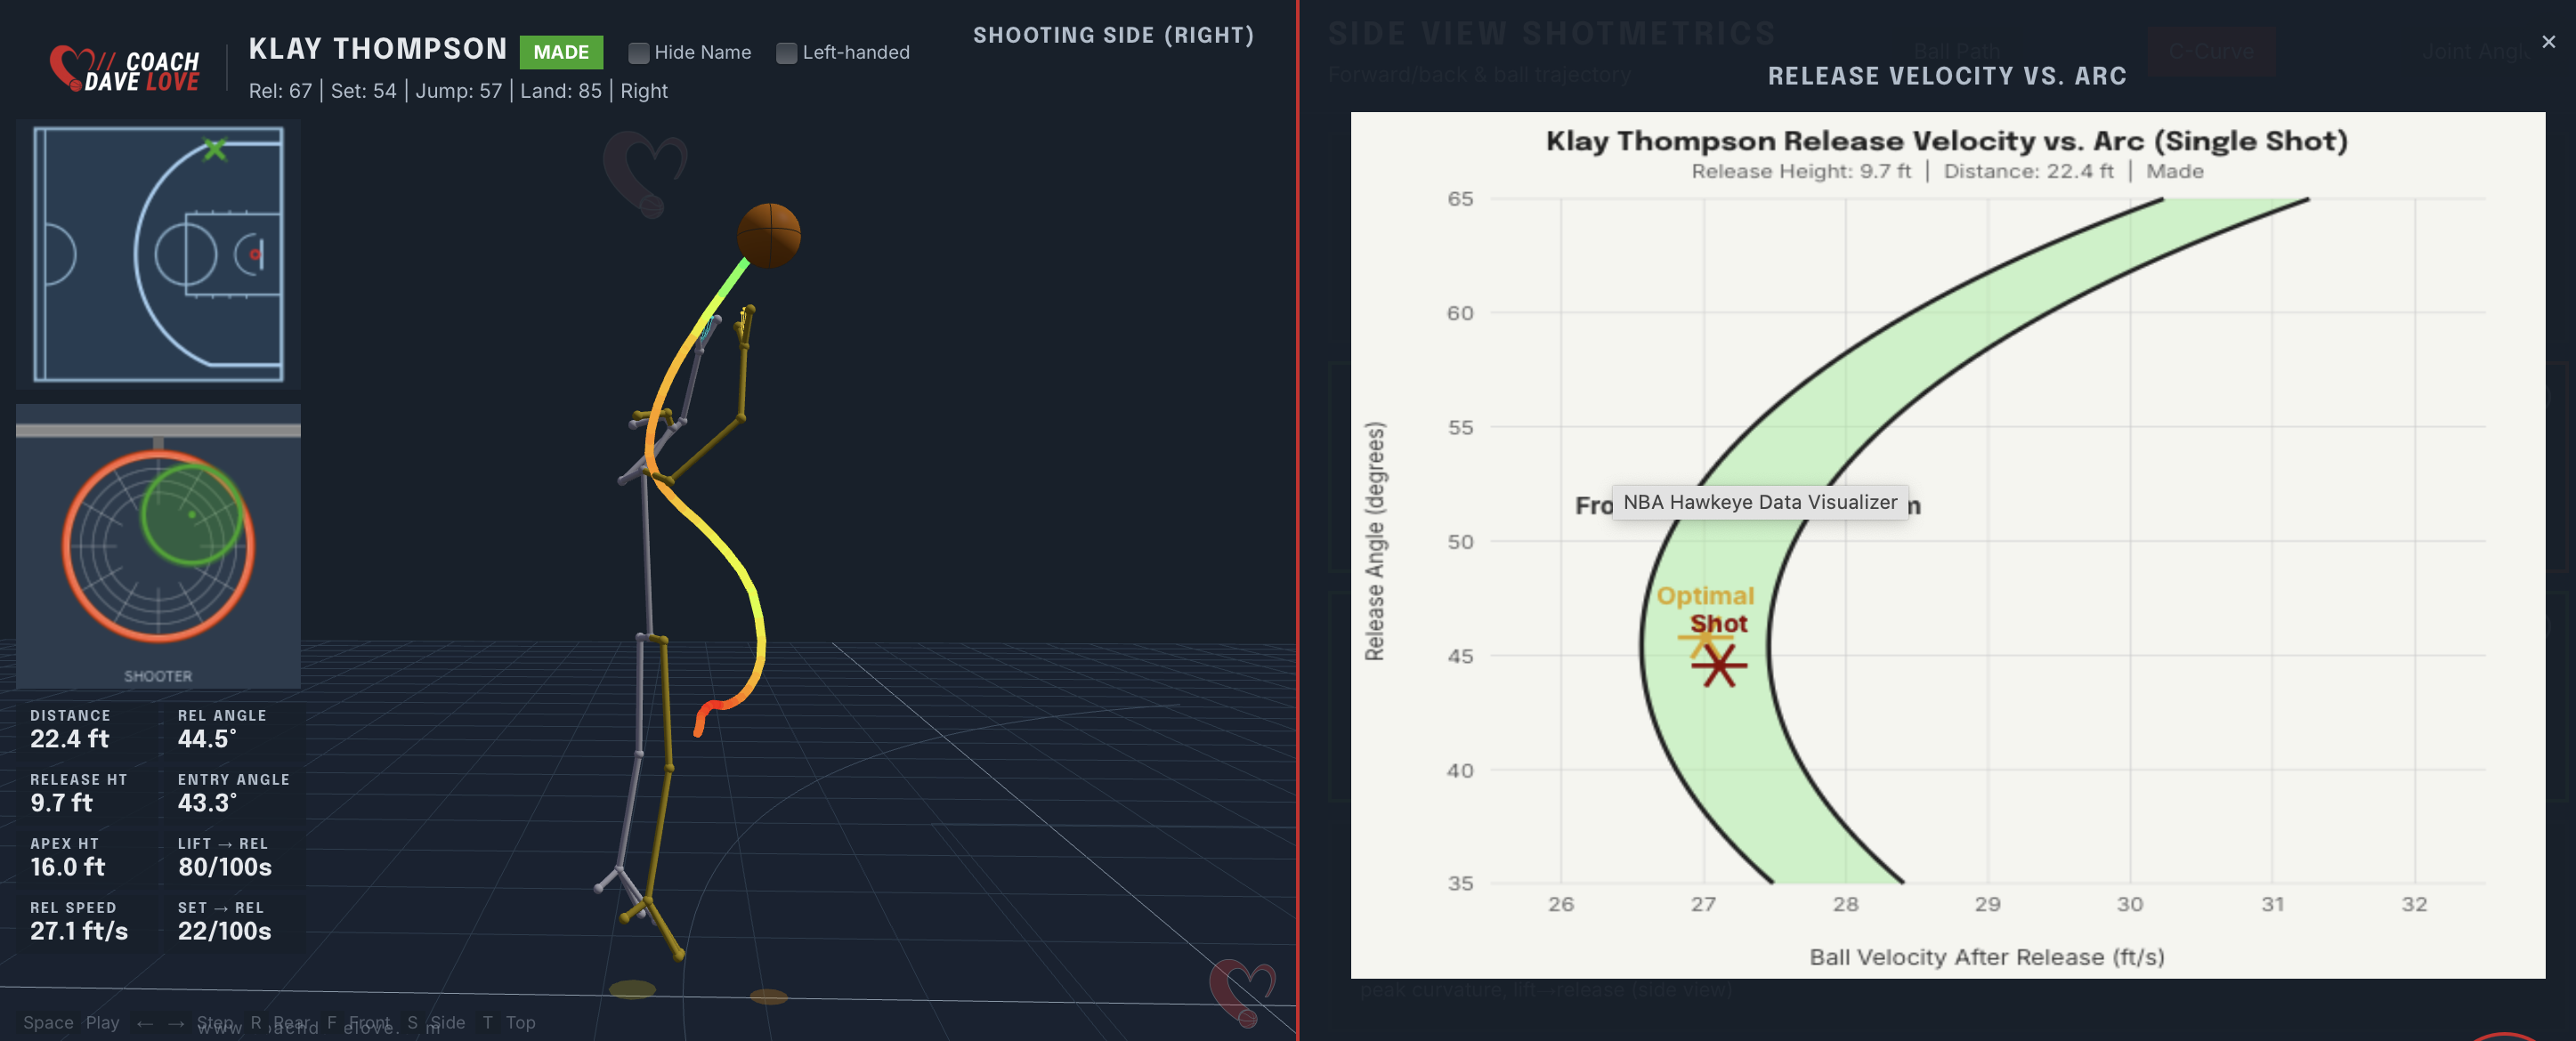
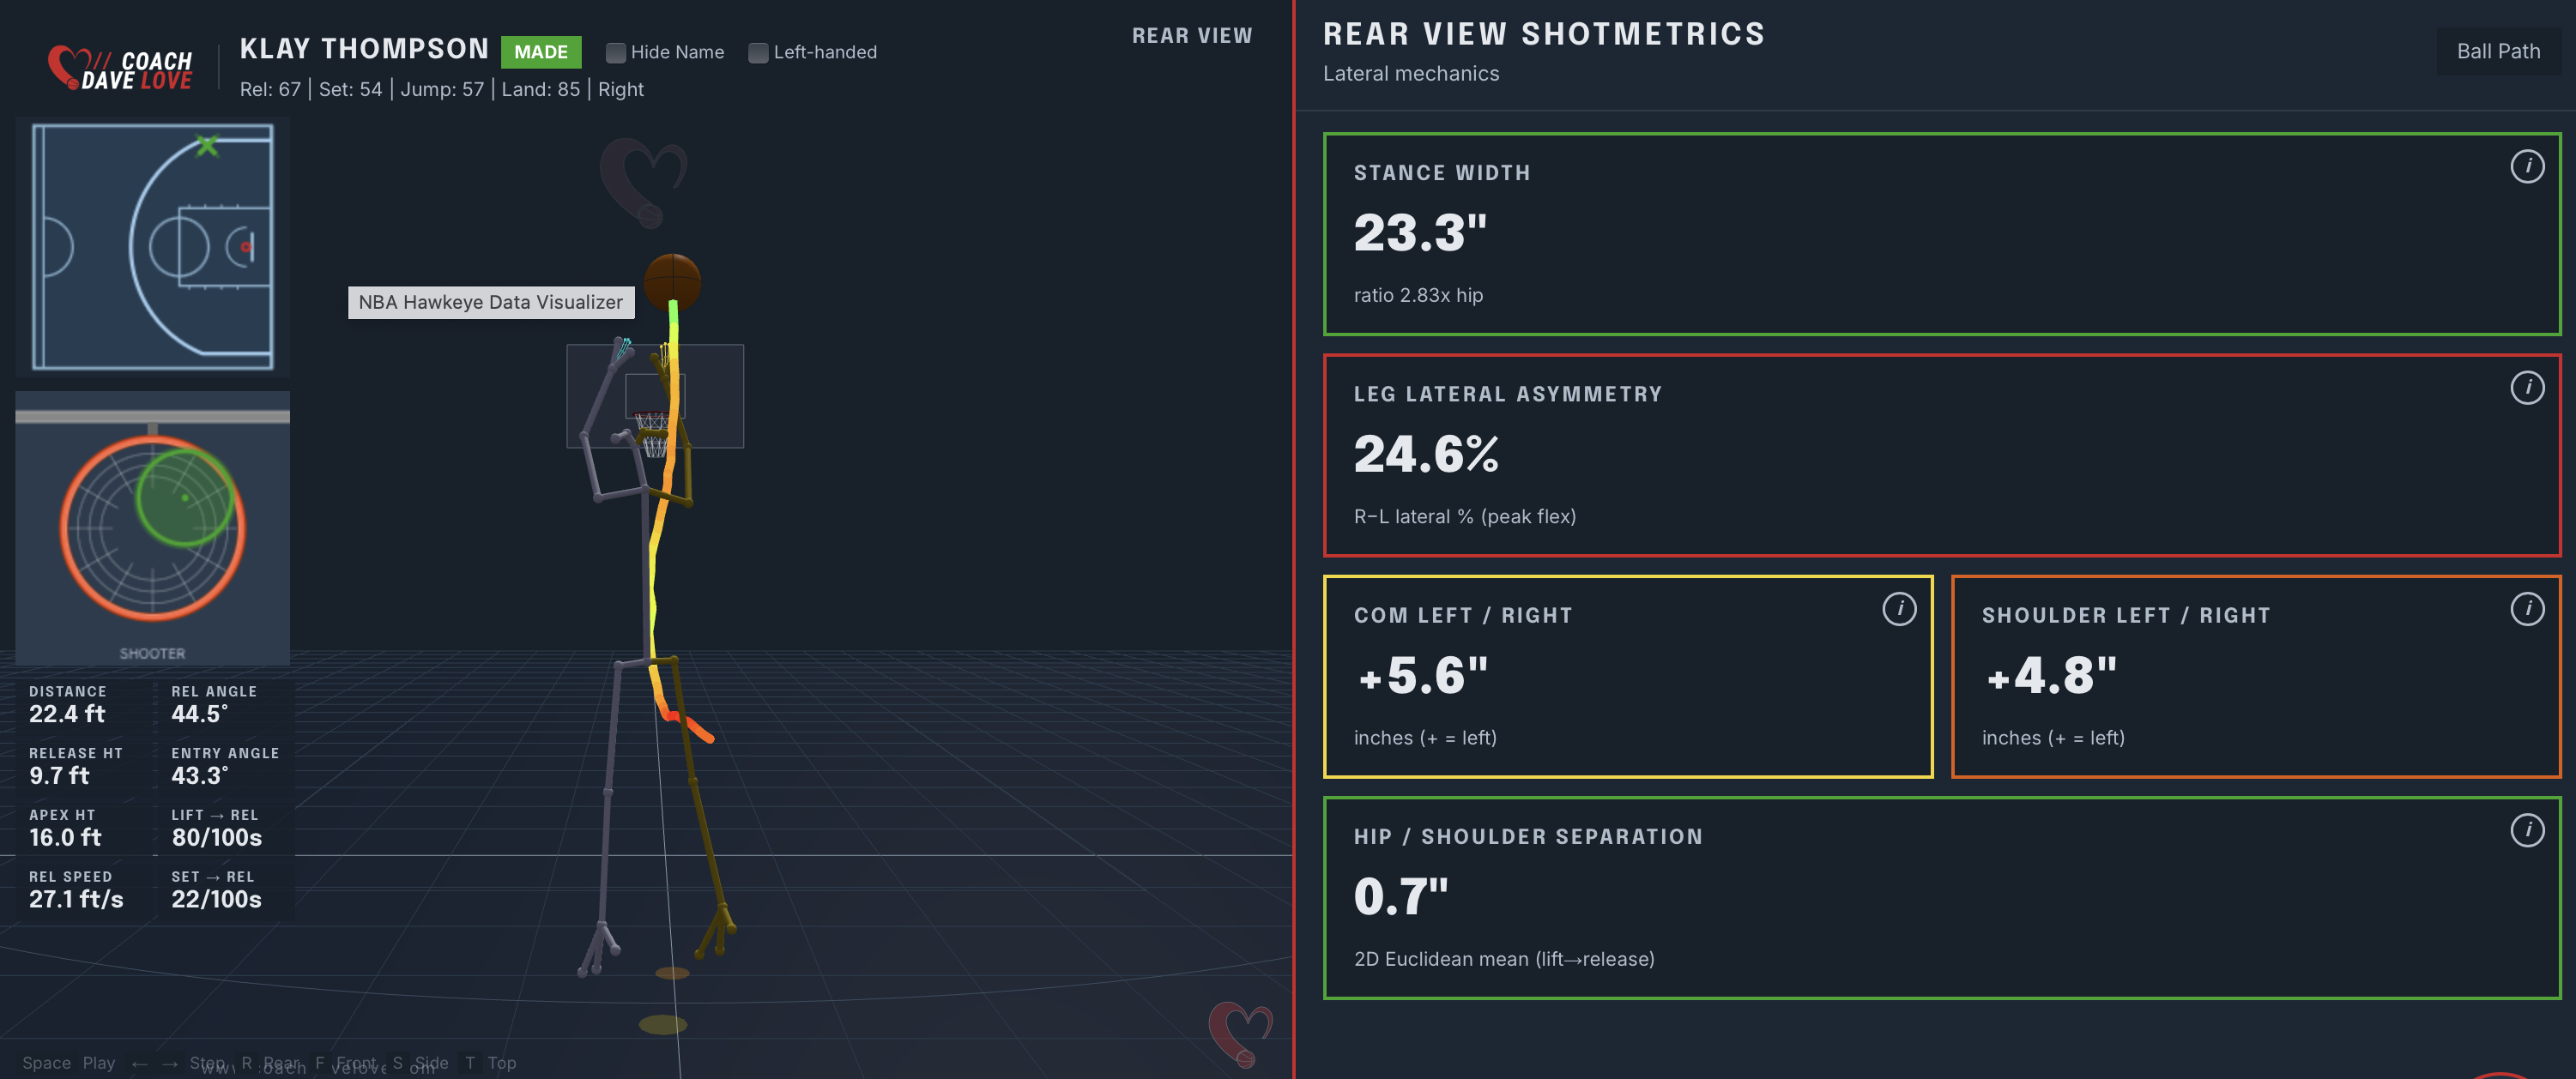
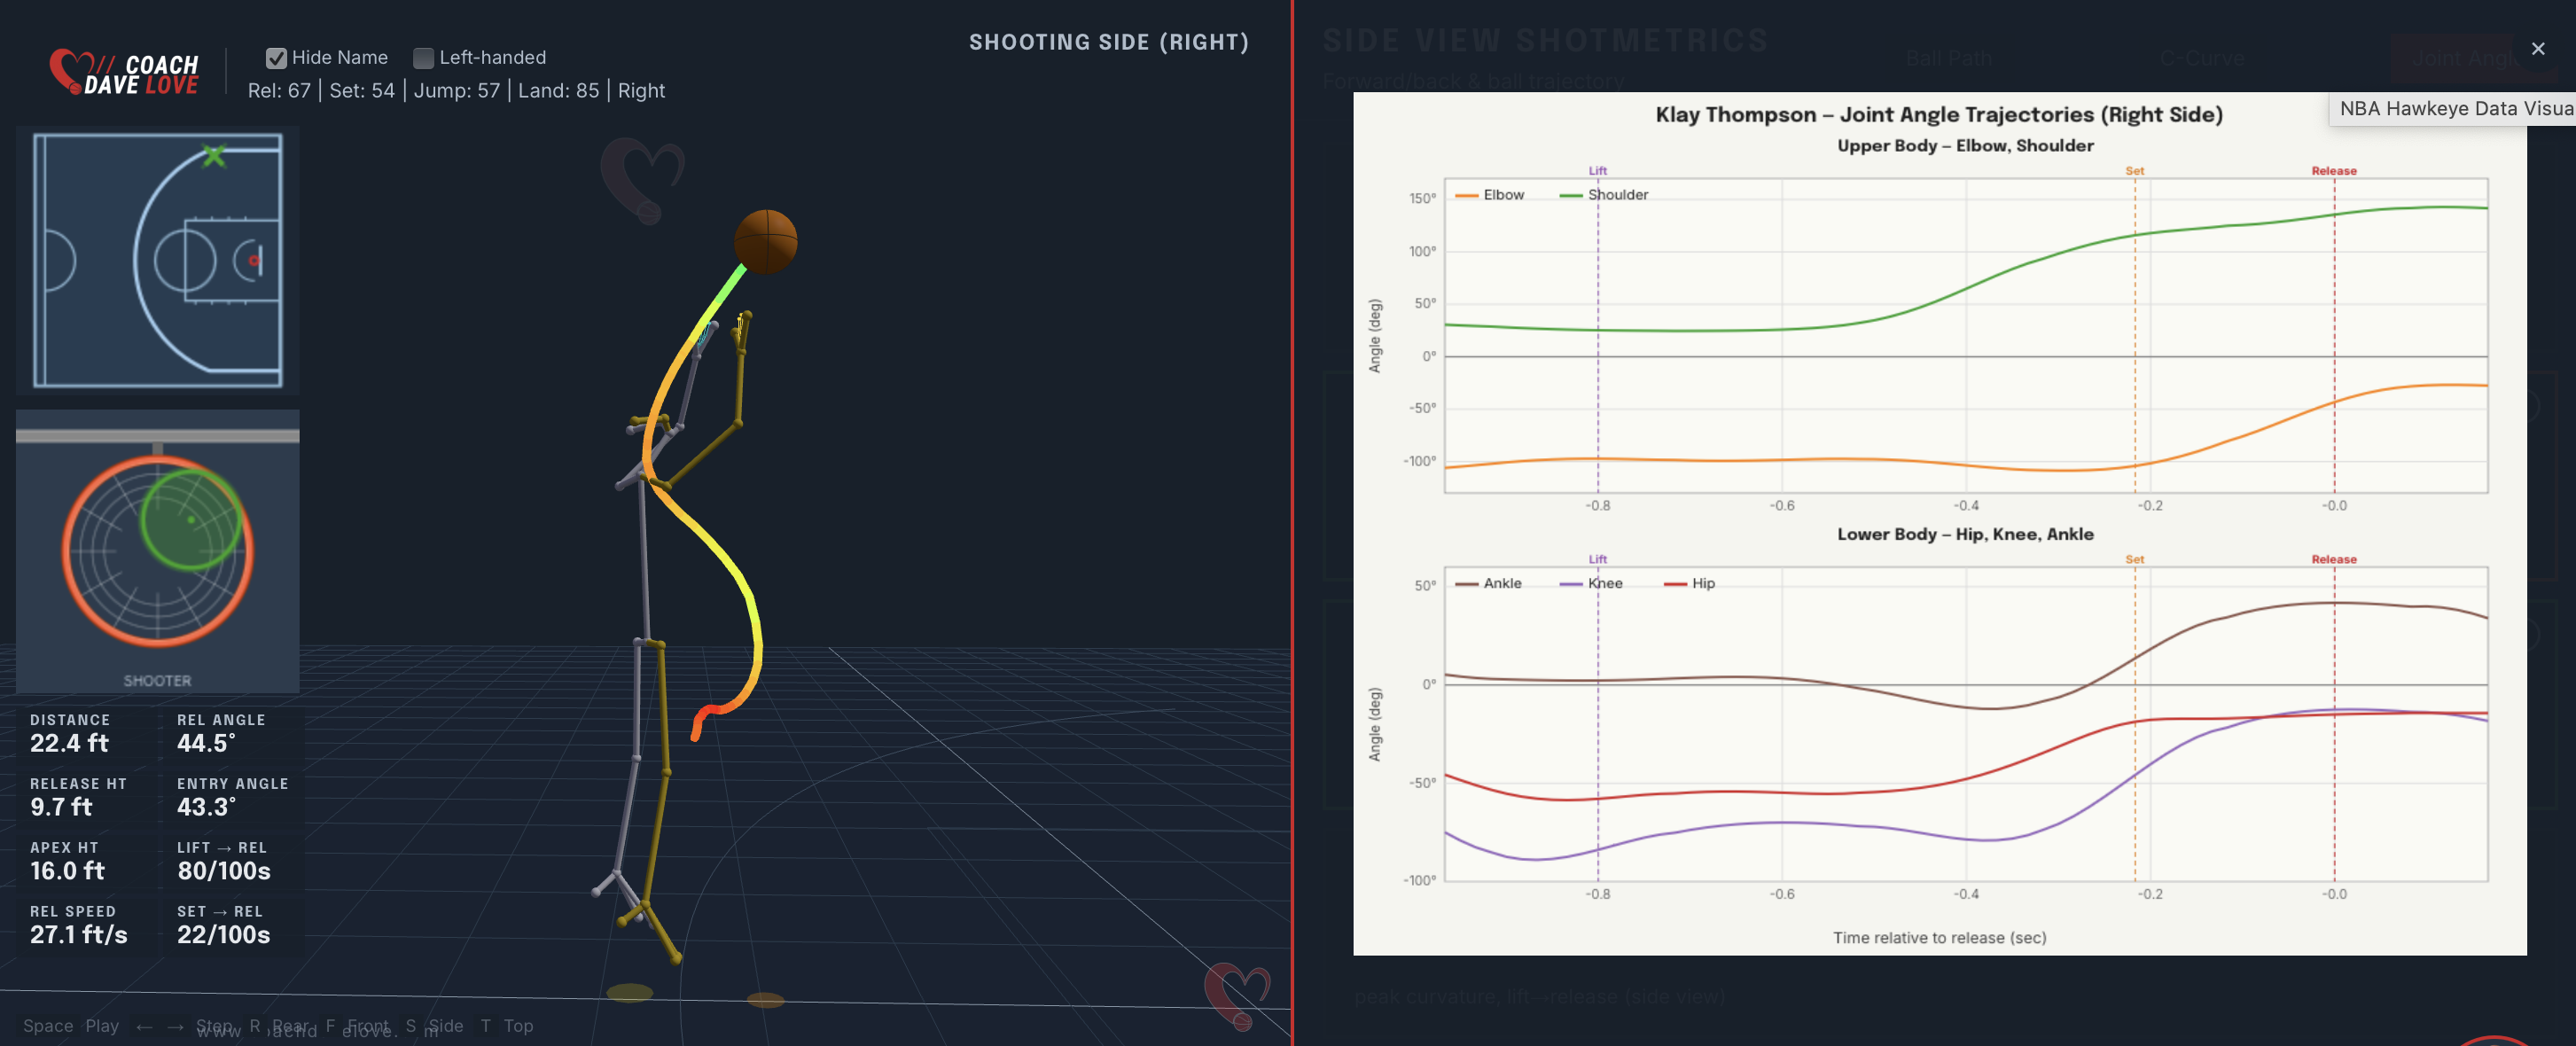
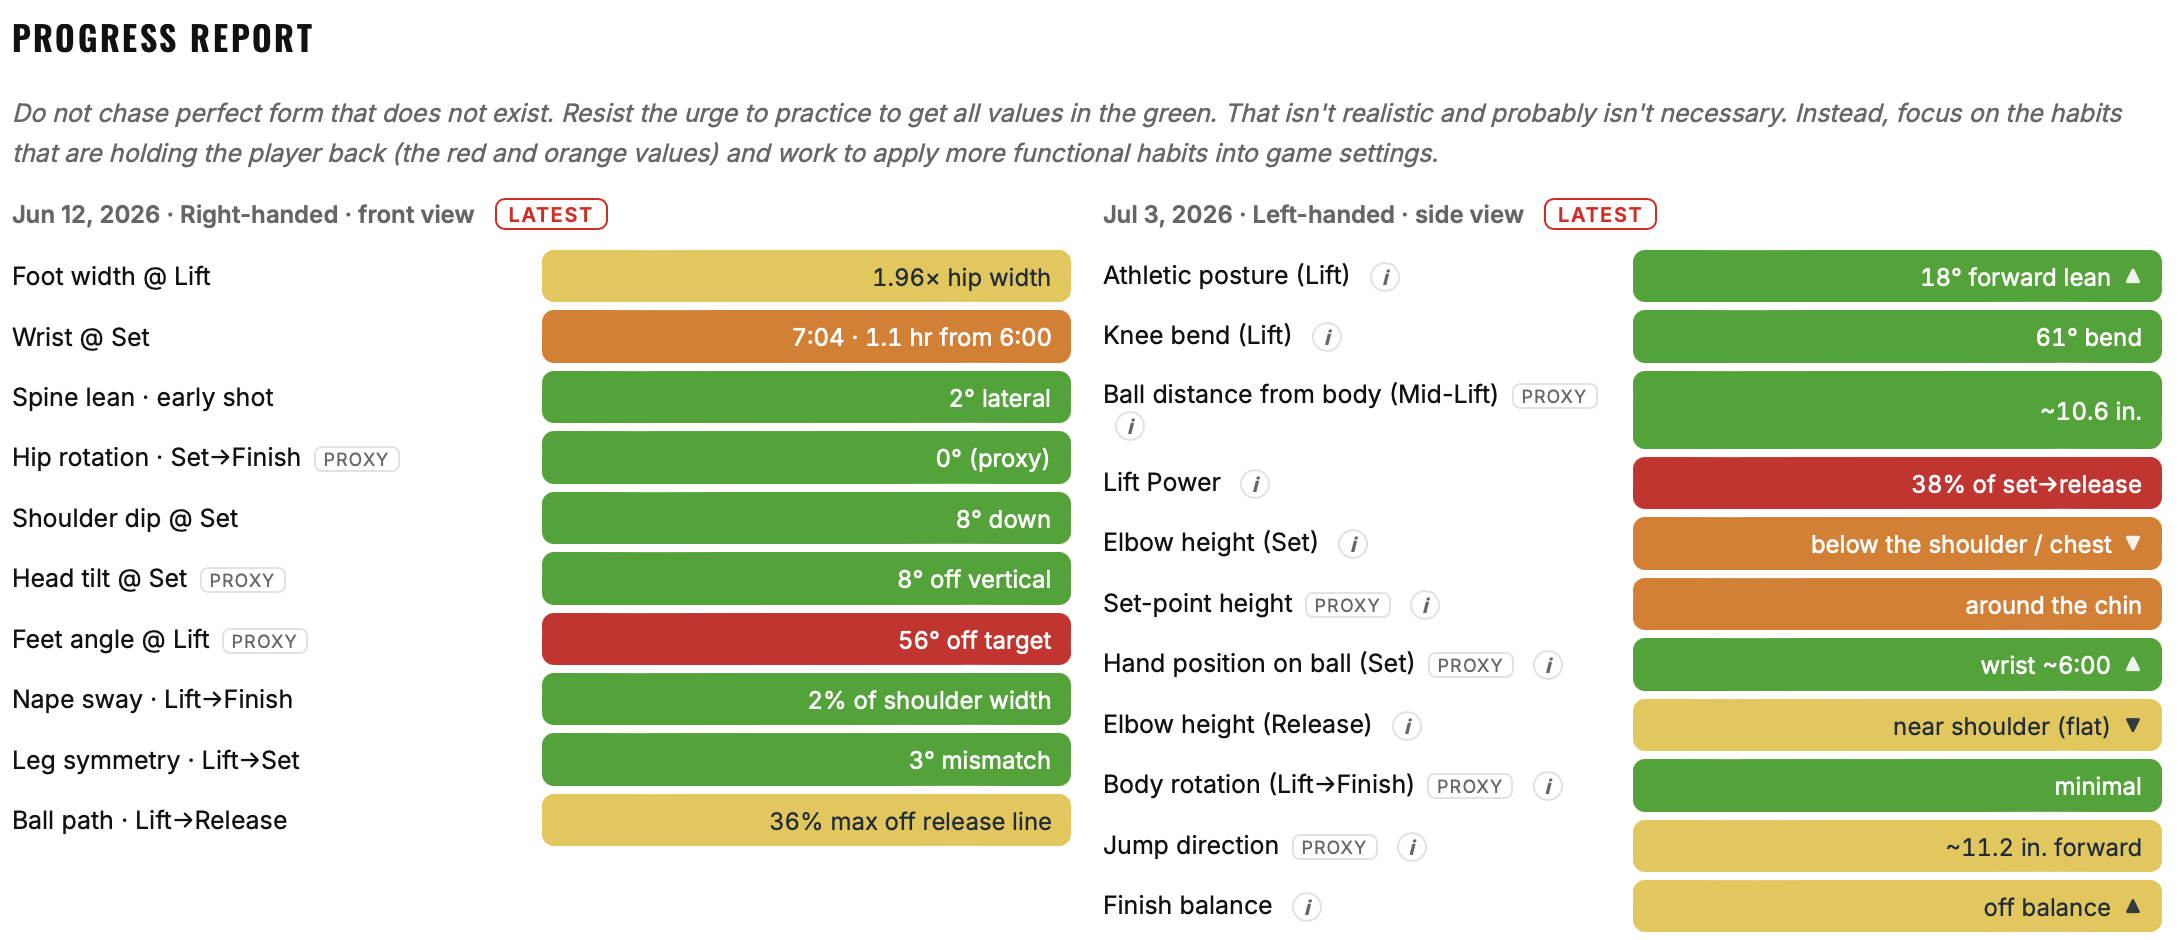
A ShotMetric never tells a player what their form should be. It reveals what's currently limiting it — the rate limiter — and lets us aim the intervention there. And notice something: many of these describe how the ball moves, not how the body moves. That makes them natural external cues, which is exactly how the best learning tends to happen.
The spin frontier
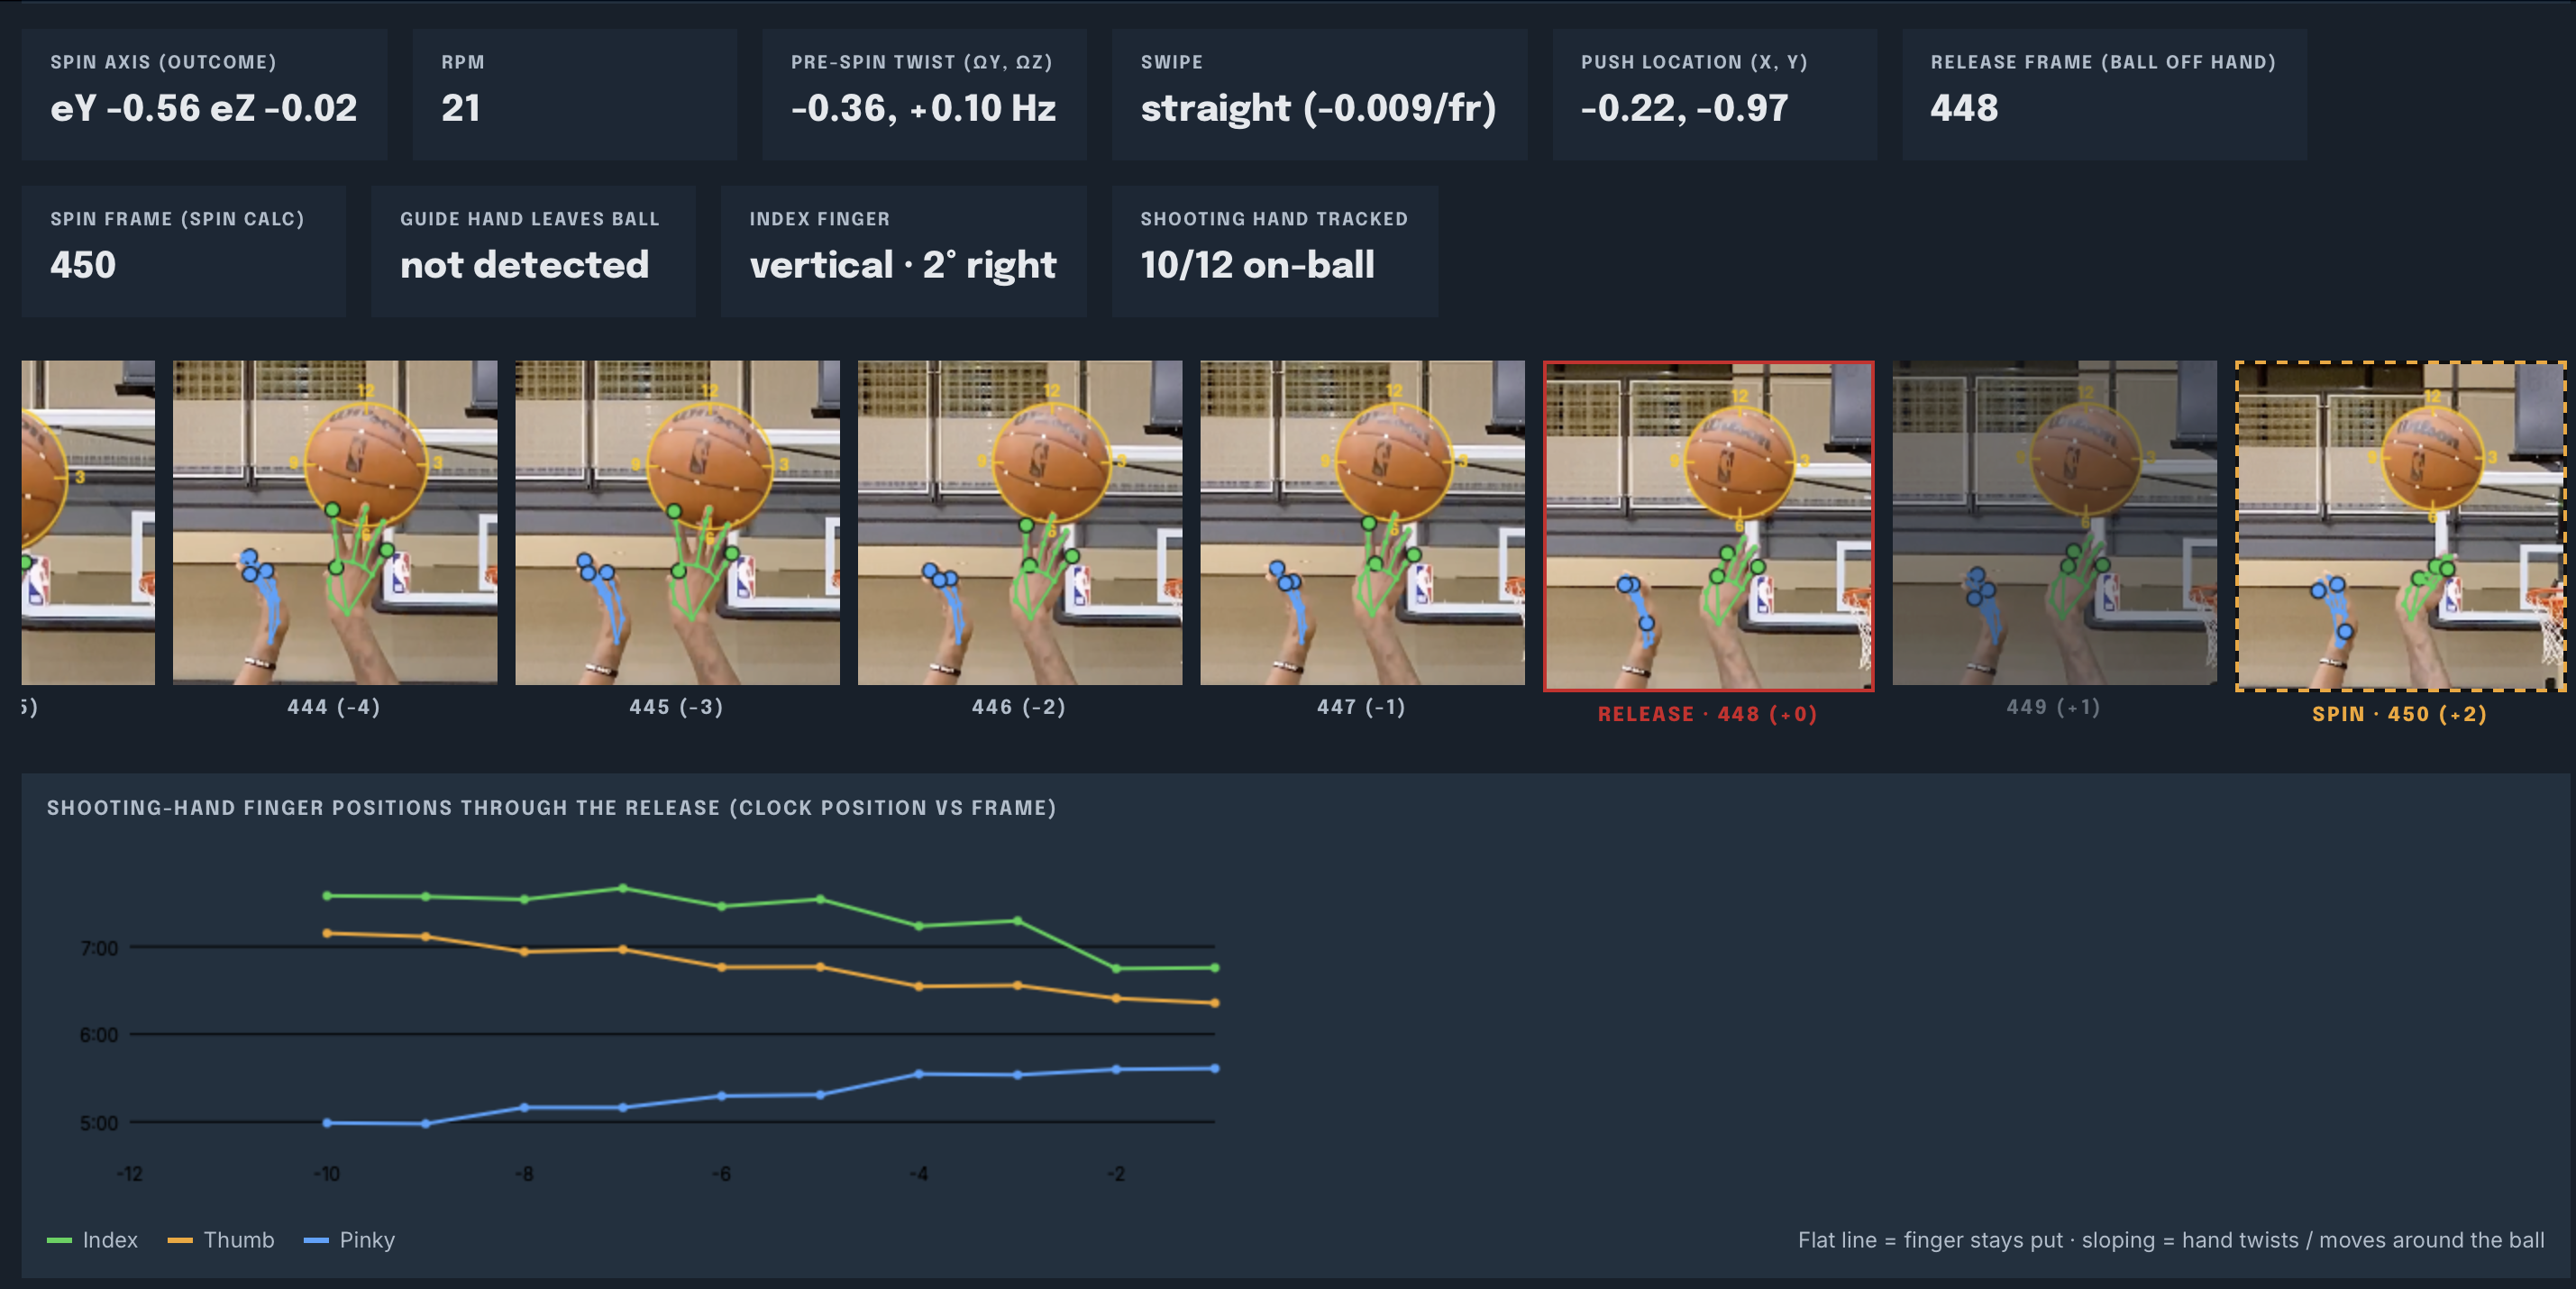
The metric I'm most excited about is spin — and it's the clearest example of how far ahead this can put a program.
Backspin isn't simply fast or slow. It has an axis, a tilt, and a wobble, and those details are tightly bound to whether a shot holds its line. Quantifying spin is genuinely hard, and to my knowledge the CDL Coaching Toolbox is currently the only tool available to the public that quantifies the spin of a basketball at all. What you can dig into depends on the data you bring:
- If your team has NBA Hawk-Eye data, my visualizer is now available inside the Toolbox to Hall of Fame members — turning that raw tracking data into a readable picture of exactly how the ball is being shot.
- If you don't, any Toolbox member can begin studying spin today with the tools built in — no proprietary feed required.
Where this is going
Basketball's measurement era is just beginning. The cameras will get sharper, the models more trustworthy, the metrics more complete. But the shift has already started, and it's the same one every other precision sport went through: the question is no longer only did it go in? — it's how clean was the attempt, and why?
If you want the whole framework — the metrics, the research behind them, and how to read a shot like data — I laid it out in my book, ShotMetrics. And if you'd rather put the metrics in your own hands — including the spin tools no one else offers publicly — that's exactly what the CDL Coaching Toolbox is built to do.
For a team, none of this is abstract. It's a sharper read on a shooter come draft night, a way to de-risk a development bet, and — maybe most valuable — objective proof of whether the work you're putting in is actually changing the shot. If that's a conversation your staff wants to have, reach out directly.
The teams that move first on this won't be the ones with the best eye. They'll be the ones who decided to measure.
References
- Slegers, N., & Love, D. (2024). The role of ball path curvature in basketball shooting accuracy. Journal of Sports Sciences, 42(21), 2052–2060. https://doi.org/10.1080/02640414.2024.2422735
- Slegers, N., & Love, D. (2022). The role of ball backspin alignment and variability in basketball shooting accuracy. Journal of Sports Sciences, 40(12), 1360–1368. https://doi.org/10.1080/02640414.2022.2080164
- Zhu, J., Love, D., & Powers, S. (2025). Ball path curvature and in-game free-throw shooting proficiency in the NBA. Working paper, Rice University.